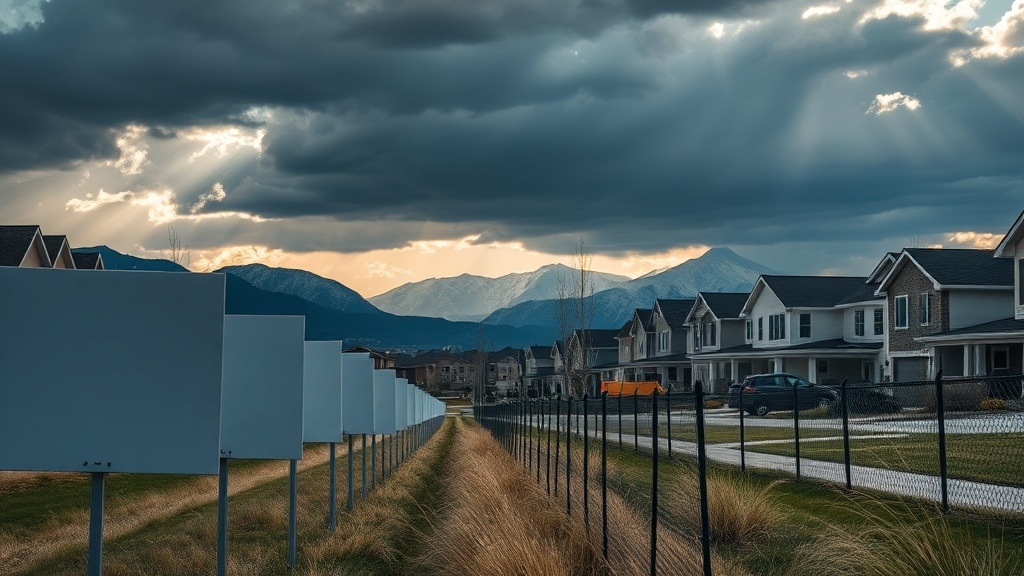
Why Is Salt Lake City Inventory Up 22%?
Although new listings in Salt Lake County fell 8.7% year over year, Salt Lake City single-family inventory still rose to 145 homes in January 2026.
That’s up 22.9% from January 2025.
With mortgage rates declining, buyers may gain purchasing power even as listings accumulate.
That increase coincided with 68 days on market, up 21.4%.
With homes taking longer to sell, more listings stayed active at month end.
NAR projections of lower rates near 6% in 2026 could further improve buyer affordability as inventory builds.
Disruption From Slower Closings
Closed sales in the county slipped 4.1%, with 621 sales against 1,227 new listings.
A slower sales pace can raise inventory without distress, especially while delinquencies remain low.
Inventory Builds Despite Lock In
Mortgage lock-in kept many owners with 4% or lower rates from listing, tightening overall supply.
Even so, seasonal listings and reduced buyer throughput pushed city inventory to 2.0 months, up 5.7% year over year.
Demand stayed steady.
Selection widened.
Where Salt Lake City Inventory Is Rising Fastest
Where inventory is rising fastest is increasingly concentrated in Sugar House, Central City, and Downtown Salt Lake City.
New supply is entering high-demand pockets as turnover rises and sales slow.
Disrupted Neighborhood Hot Spots
Sugar House is seeing a wider unit mix, including larger family options.
Modest rent growth is also nudging some renters toward purchases.
Income gains from major employers are supporting new listings without signs of distress.
Central City is absorbing new construction along the Wasatch Front.
Demand for updated amenities is accelerating moves in and out.
Vacancy edged up in early 2026 as population growth meets fresh supply.
Higher mortgage rates near 6.7% are also stretching affordability and slowing buyer activity even as listings rise.
Supply Pressure in High Rise Clusters
Downtown deliveries are increasing choices and approaching 2017–2019 inventory norms.
Low-rate lock-in is easing as some owners relocate near transit corridors.
- New builds
- Larger units
- Amenity upgrades
- Slightly higher vacancy
- Builder deliveries
What Salt Lake City Inventory Means for 2026 Prices
As Salt Lake City inventory rises from slowed sales and builder deliveries, pricing power is shifting from sellers to the broader market.
That shift points to 2026 prices staying flat with gains, not distress driven declines.
Price Shock Risk Fades
More listings in Sugar House, Central City, and downtown lengthen marketing times toward 39 days.
With Utah still undersupplied versus the 28,000 homes needed annually, inventory growth is expected to normalize competition, not trigger oversupply.
Valuation and Cost Pressures
Appraisal trends are likely to track stability, with county medians up about 3.8 percent since 2022 and Zillow near 557,482.
Tax implications may rise as assessments follow slow appreciation toward 560,150 to 572,200 by 2027, while 5.9 to 6.3 percent rates cap upside.
How Salt Lake City Inventory Changes Your Offer
While Utah inventory climbed to 10,839 homes by February 23, 2026, the added selection has shifted Salt Lake City offers away from urgency premiums.
Median days on market rose to 36, widening decision windows.
Disruption in Offer Construction
More listings in Sugar House, Central City, and downtown reduce bidding war probability.
Only 25.5% of sales clear over list, and 51.9% close under list.
Buyers can reintroduce an inspection contingency and an appraisal strategy without losing competitiveness.
A 0.998 sale-to-list ratio supports terms focused on risk control, not escalation.
Key offer adjustments
- Seek repair credits from inspection findings.
- Set appraisal gap limits with comps.
- Shorten deadlines to test motivation.
- Target well-priced homes, clean financing.
- Use longer contingencies as days on market rise.
When to Buy or Sell With Rates + Inventory in 2026
Even if mortgage rates drift toward the high-5% range by late 2026, Salt Lake City remains constrained by low supply.
Inventory was 2.0 months in January 2026, well below a balanced market.
Buying Window Signals
Days on market increased to 68, expanding negotiation room after inspections.
A rate lock limits payment swings as Utah inventory is projected to rise 9% in 2026.
Closing flexibility improves with more listings, but demand still outpaces supply.
Utah prices are forecast to gain 3 to 4%, with 4 to 6% in Salt Lake County.
Selling Risk Signals
The city median near $670,000 reflects strong annual growth but tighter affordability.
County inventory rose 22.5% to 3.6 months, raising the risk of stale, overpriced listings through late 2026.
Assessment
Salt Lake City inventory expanding at this pace signals a widening gap between supply and prior demand intensity. Higher active listings typically lengthen days on market and increase the frequency of price reductions.
For 2026, pricing power is likely to shift toward well-located, move-in-ready homes while weaker listings stall. Offer terms may harden around inspection, appraisal, and closing costs as sellers absorb more competition.
With rates elevated, transaction volume may stay constrained even as inventory climbs further.