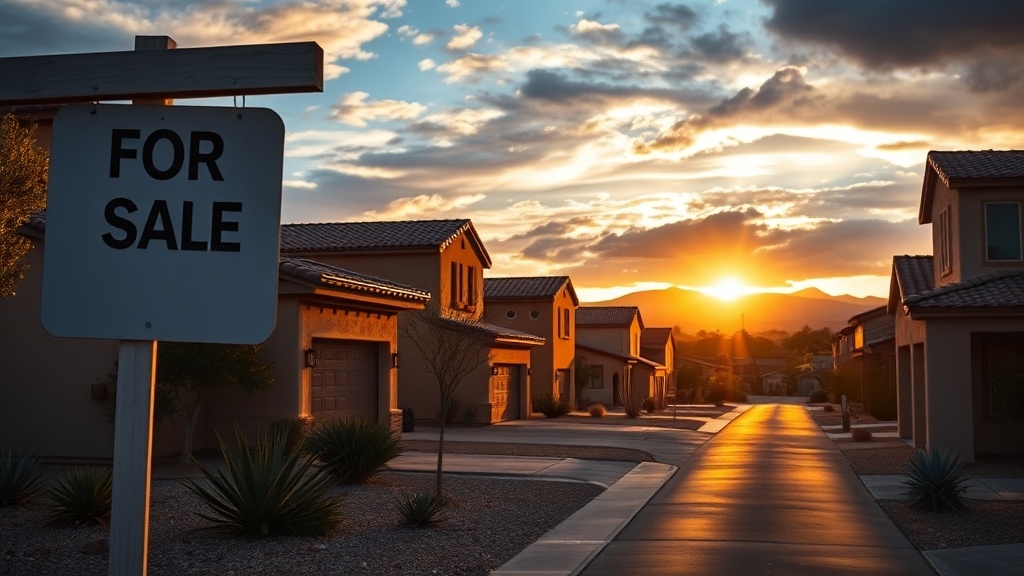
Austin Lot Glut in 2026: What It Is
More than 10,000 active residential listings in late 2025 signaled a widening glut of available homes across the Austin market.
Active listings hit about 10,372 in December 2025, up 9.2% year over year.
The market also moved toward balance with 4.2 months of inventory in December 2025.
Elevated 6.83% mortgage rates continued to weigh on buyer demand and absorption.
Glut Definition
The lot glut reflects build-ready supply accumulating faster than absorption.
Months of inventory rose to 5.0 in January 2026.
Longer marketing cycles increase carrying costs and ecological impact from extended site disruption.
In January 2026, total volume sold fell 7.6% to 1,566 homes.
Disrupted Mechanics
Days on market crossed 100 in January 2026.
The average close-to-list price fell to 90.9% in December.
Seller success dropped to 72% as inventory lingered.
Peak 2025 inventory reached 15,000 to 17,000 listings, creating infrastructure strain when pipelines outpaced sales.
Why Austin Land Demand Collapsed in Late 2025
Although Austin entered late 2025 with abundant build-ready supply, land demand weakened as the buyer pool thinned and financing costs stayed restrictive.
Statewide, a 30% jump in active inventory is also shifting leverage toward buyers going into 2026.
Migration Reversal Deepens the Buyer Shortfall
Inflows Fade
Domestic inflows into Texas fell well below the 2021 to 2022 surge.
Remote work pullbacks and return moves reduced household formation, and U-Haul data pointed to rising outbound risk into 2026.
Affordability Collapse Locks Out Locals
Costs Stay High
The home value to income ratio stayed far above long run norms, even after typical values slid from $553,000 to $420,000.
Mortgage rates near 6.5 to 7.0 percent and higher property taxes limited qualification.
A 22 percent rent drop and a 24 percent price correction cooled investor appetite for land.
Exurban inventory kept buyers cautious.
Austin Builder Incentives: How Margins Got Crushed
As buyer caution persists and mortgage rates hold near 6.18 percent, Austin builders are leaning harder on incentives to keep new construction moving.
Concessions now dominate new construction listings.
Incentives Surge, Margins Compress
Community counts are up 11 percent, and each sale takes more time overall.
Builders rely on concession structures like rate buydowns and closing cost credits to avoid deeper price cuts.
Seventy percent of builders report conditions weaker than expected.
Cost Pressures Force Cost Shifting
Tariffs, uncertainty, and rates above 6 percent keep financing and inputs elevated.
NAHB expects mortgage rates above 6 percent through 2026.
Cost shifting shows up when builders pay points, upgrades, and fees that buyers cannot absorb.
Single-family construction is projected to decline 3 percent in 2026 in Austin.
Where the Austin Lot Glut Is Worst (Submarkets)
Builder incentives are masking price weakness in parts of the Austin metro. But they are not absorbing the growing lot overhang across the northeast corridor.
Pflugerville saturation and Hutto are leading indicators.
Price Cuts Concentrate in Pflugerville and Hutto
Pflugerville’s median price fell over 20% year over year.
That’s a $91,000 correction.
Sales volume still climbed 25%.
Hutto also logged a 20%+ median drop.
Demand Collapse Deepens in Manor and Round Rock
Manor overhang shows in new home sales, down 58.3% from 36 to 15.
Homes are also sitting for roughly three months on market.
Round Rock carries elevated inventory and longer market times.
Georgetown retains premium pricing with rising values.
Longer listings and weaker prices per square foot in Manor and Round Rock are shifting negotiating power.
What the Austin Lot Glut Means for 2026 Buyers & Investors
While Austin’s for sale inventory keeps swelling, 2026 buyers and investors are entering a market where time and leverage have shifted away from sellers.
Active listings rose 9.2% to 10,372 in December 2025, and months of inventory reached 5.0 in January 2026.
Buyer Leverage Intensifies
Median sales price fell 3.3% year over year to $435,000, with close to list at 90.9%.
Days on market topped 100, and seller success dropped to 72%.
Investor Risks and Plays
Financing Strategies now emphasize concessions, rate buydowns, and conservative appraisals.
Pendings rose 6% in January 2026, but 2025 sales fell 3.2%.
Demand remains constrained despite 20% to 25% inventory gains across peak periods.
Rental Conversions look stronger than quick flips as balance is expected by early 2027.
Assessment
By early 2026, excess developed lots in Austin are forcing builders to cut prices and expand incentives. The imbalance reflects a sharp late-2025 demand slowdown, tighter affordability, and higher carrying costs for land.
Submarkets with heavy recent entitlements face the fastest resets, while infill remains comparatively insulated. Buyers gain leverage through price transparency and option-heavy contracts.
Investors confront reduced absorption, longer hold times, and heightened valuation risk. Financing terms are expected to stay restrictive locally.