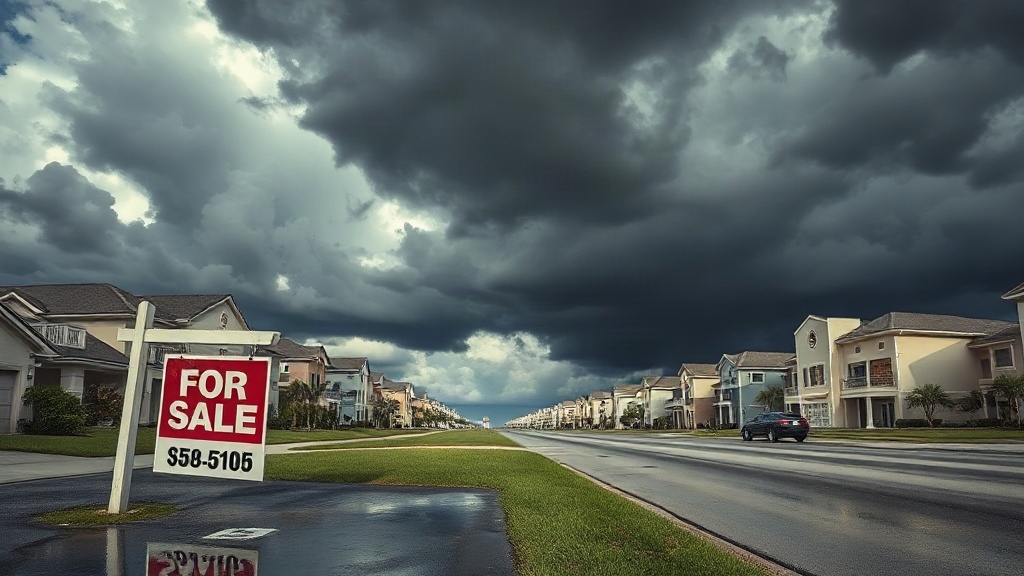


The 8 South Florida Cities at the Bottom
Several South Florida cities landed near the bottom of Florida’s housing market ranking, signaling a broad stretch of weakness across the region.
Hollywood ranked 285th with a 43.13 score, the weakest South Florida showing in this set. Pompano Beach ranked 271st at 45.74. Miami Beach ranked 294th overall with a 39.33 score, making it the state’s lowest-ranked market.
Coral Springs ranked 262nd, Fort Lauderdale 253rd, Sunrise 244th at 48.41, and West Palm Beach 241st at 48.75. Plantation placed 210th, still in the lower tier.
Regional Pressure Signals
Broward County dominated the weak cluster, with Hollywood, Pompano Beach, Coral Springs, Sunrise, Fort Lauderdale, and Plantation all landing low. West Palm Beach extended the pattern into Palm Beach County.
The spread across coastal and inland markets points to regional strain, not one isolated problem. Rising interest rates and softer rental conditions, including a 7.1% vacancy rate, may be adding to affordability pressure and weakening demand across these markets. The pattern suggests economic spillover, affordability pressure, and shifting commuter patterns affecting demand and market strength.
Miami Beach Ranks as Florida’s Weakest Market
At the bottom of the statewide list, Miami Beach ranked No. 294 out of 300 cities in the 2026 worst real estate markets survey. That made it the weakest market in Florida in that set.
Its total score reached 39.33. Its real-estate market rank came in at 293, while its affordability and economic environment rank landed at 228.
Slow Sales and Value Pressure
Home values averaged $528,434 in July 2026. That was down 0.4% from a year earlier.
Homes also took about 107 days to go pending. That points to a slow sales pace and limited buyer urgency.
Structural Weakness
Broader Miami-area listing declines did not improve Miami Beach’s standing.
Florida’s foreign buyer rules under SB 264 have also added pressure to investor activity by restricting some overseas purchases and increasing compliance burdens.
The data pointed to high costs, weak demand, tourism dependency, and climate migration pressures. Together, those factors left Miami Beach below nearly every other Florida city surveyed.


Why South Florida Housing Markets Fell in 2026
Because borrowing costs stayed high and ownership expenses climbed, South Florida housing markets lost momentum in 2026.
Elevated rates weakened affordability and triggered mortgage rate churn, leaving many buyers sidelined.
Monthly payments rose enough to strain first-time purchasers and increased pressure on sellers to cut prices or wait longer.
Insurance costs added a second blow.
Storm risk and coastal exposure kept premiums unusually high, deepening affordability problems and contributing to insurance driven displacement in higher-cost communities.
Condo Weakness Deepened the Slide
Condos became the region’s clearest drag.
Reserve requirements, inspections, and special assessments hit older buildings hardest, while rising inventory gave buyers more leverage and pushed valuations lower.
Across the region, softer sales, growing supply, and risk concerns reduced confidence and reinforced buyer caution throughout 2026.
Broward County’s Biggest Real Estate Laggards
Led by weakness in attached housing, Broward County’s biggest real estate laggards in 2026 were concentrated in condos and townhouses rather than single-family homes.
Countywide, condo and townhouse prices fell 2.8 percent in January from a year earlier, bringing the median sold price to $250,000, the lowest level since August.
That decline extended a year-long slide, even as sales volume improved modestly.
Pompano Beach Pressure
Pompano Beach stood out among the weakest city markets.
Its median price was about $360,000 in January 2026, down 11.5 percent year over year, making it one of Broward’s clearest underperformers.
Buyer leverage remained elevated because condo oversupply kept months of supply at 10.1 countywide.
That created soft resale conditions, widespread price cuts, and slower absorption across attached housing listings.
Miami-Dade and Palm Beach Weak Spots
Miami-Dade showed clearer market drag in 2026 as condo supply moved far above balanced levels.
Prices also softened from prior highs.
Palm Beach showed weakness signals as well, especially in condo inventory and in areas outside its strongest demand nodes.
Across both counties, pressure centered on financing limits and higher ownership costs.
A widening split also emerged between resilient single-family enclaves and more vulnerable condo stock.
Miami-Dade Market Drag
Although South Florida sales activity showed resilience, Miami-Dade remained a drag point in 2026. The market split widened between firm single-family pricing and a softer condo segment.
Uneven Pricing Pressure
Single-family median pricing stayed near $695,000 in June. Condo values softened to about $431,000, down 3.15% year over year.
The divergence reflected condo oversupply and rising price sensitivity among buyers.
- Condo inventory reached roughly 11,550 listings in June 2026.
- Condo supply equaled about 13.2 months, firmly favoring buyers.
- Total active listings fell to about 15,930 in June.
- Single-family inventory declined to 4,599 in May.
- Sales rose, but pricing power remained uneven.
Closed sales improved in spring 2026, yet gains did not restore broad pricing stability. Miami-Dade remained a mixed market where tighter supply failed to lift condo conditions decisively.
Palm Beach Weakness Signals
In Palm Beach, weakness signals grew harder to ignore as city-level pricing turned sharply lower. Broader county measures, however, stayed comparatively stable.
Palm Beach’s median sale price fell to $2.6 million, down 31.2% year over year. That points to a clear decline in the luxury segment.
Countywide, the median reached $538,500 in February 2026, up 3.1%. This suggests localized softness rather than a broad market collapse.
| Metric | Palm Beach City | Palm Beach County |
|---|---|---|
| Median price trend | Down 31.2% | Up 3.1% |
| Buyer leverage | Not very competitive | About 5% off list |
| Market pace | Slower | 69 to 89 days |
Inventory dynamics added more pressure. County supply stood at 6.38 months in February.
Active listings also remained elevated above 12,000 through the summer. Longer marketing times and weaker sales reinforced a buyer-favored market.
How WalletHub Measured These Housing Markets
How WalletHub Measured These Housing Markets
WalletHub ranked housing markets by comparing 300 U.S. cities nationwide. It used city proper data, not broader metro-area figures.
The scoring model factored in real-estate market conditions, affordability, and economic indicators. Each metric was graded on a 100-point scale.
Final rankings were based on weighted averages across 17 measures. Higher scores signaled stronger conditions for home buyers.
WalletHub Ranking Criteria
Measured against 300 U.S. cities, the WalletHub ranking assessed housing markets at the city-proper level rather than across broader metro areas.
Its market methodology used a relative comparison, not an absolute grade of housing health. Cities were scored through weighted averages, making metric weighting central to final placement.
Framework Used
Two dimensions shaped the analysis: real estate market conditions and affordability with economic environment. The 2026 housing-market study used 17 metrics across those dimensions.
Each metric was scored on a 100-point scale. Higher combined scores indicated healthier market conditions within the study framework.
Criteria can change by report year, so exact methods must match the cited study.
The ranking therefore reflected overall local housing-market attractiveness, based on combined market and economic indicators, rather than any single measure alone.
Market Score Factors
Across 17 weighted indicators, the scoring system examined far more than sale prices alone.
Affordability Pressure
It weighed affordability against local income. It also factored in insurance, cost of living, cost per square foot, and property-tax burden to show the full ownership strain facing buyers.
Health, Supply, and Access
Market health also mattered. Measures included rent-to-price relationships, recent appreciation, homes sold within a year, and the share of borrowers with negative equity.
Supply-and-demand conditions captured inventory dynamics through price cuts, recent construction, building permits, and the buy-versus-rent breakeven period.
Financing access appeared through mortgage lenders per capita. Agent density, millennial homeownership, days on market, foreclosure signals, and home value forecasts helped reflect competition, stress, resale strength, and expected direction.
National Comparison Method
For the national comparison, the study ranked 300 U.S. cities using city proper boundaries rather than broader metro areas.
This design supported regional comparisons while keeping the focus on local market conditions, not statewide trends or spillover effects.
How WalletHub Scored Cities
WalletHub used two dimensions and 17 metrics, with each metric converted to a 100-point scale and combined through weighted averages.
The scoring framework included:
- Real estate market conditions
- Affordability and economic environment
- Home-value appreciation and days on market
- Foreclosure, vacancy, and permit activity
- Income, job growth, unemployment, and credit conditions
Higher scores reflected healthier buyer-oriented markets relative to other cities in the sample.
Because rankings were relative, not benchmarked to a fixed national standard, yearly changes in metrics or weights could alter results and policy implications markedly.
What These Rankings Mean for Buyers and Sellers
Reading these rankings as a market signal, buyers and sellers in South Florida face very different conditions depending on property type.
Buyer Leverage Expands in Softer Condo Segments
Condo buyers generally have more negotiating power in areas where supply is high and listings stay on the market longer.
With roughly 10.1 months of condo supply in Broward and 13.2 months in Miami-Dade, buyers can compare more listings and push for concessions.
They can also take more time to refine financing strategies and inspection priorities.
Sellers Face Tighter Pricing Pressure
Sellers in weaker segments need to price accurately from the start.
Overpriced condos can sit longer, especially when buyers are closely reviewing reserves, insurance, assessments, and building condition.
Single-Family Homes Show More Stability
Single-family homes remain relatively stronger, with tighter supply and less room for negotiation.
Still, slower rankings suggest more caution around resale timing, concessions, and near-term appreciation.
Which Florida Housing Markets Ranked Higher
Several Florida housing markets ranked above the weakest South Florida cities in the same statewide rankings, showing that market softness was not uniform across the state.
Clearwater ranked 255th, ahead of Pompano Beach, West Palm Beach, and Plantation. Fort Lauderdale placed 253rd, while Coral Springs ranked 262nd.
Cape Coral stood at 278th, still above Miami Beach and Hollywood. These results suggest housing policy shifts and regional investment patterns shaped conditions differently.
Markets Showing More Resilience
Clearwater outperformed several weaker South Florida cities. Fort Lauderdale ranked above Miami Beach and Hollywood.
Coral Springs placed ahead of Miami Beach overall. Jacksonville, Orlando, Tampa, and Pensacola were absent from the bottom group.
Orlando, Tampa, Jacksonville, Ocala, and Port St. Lucie posted stronger affordability positions in separate coverage. Together, these rankings pointed to uneven pressure across Florida markets statewide.
Assessment
South Florida’s concentration near the bottom of WalletHub’s housing market rankings signals broad regional strain rather than isolated underperformance.
Weak affordability, softer demand, and market imbalance pushed several Miami-Dade, Broward, and Palm Beach cities into vulnerable positions in 2026.
For buyers, the rankings suggest increased leverage in select areas.
For sellers, they indicate tougher pricing conditions and longer competition cycles.
The contrast with stronger Florida metros underscores how uneven the state’s housing slowdown has become.