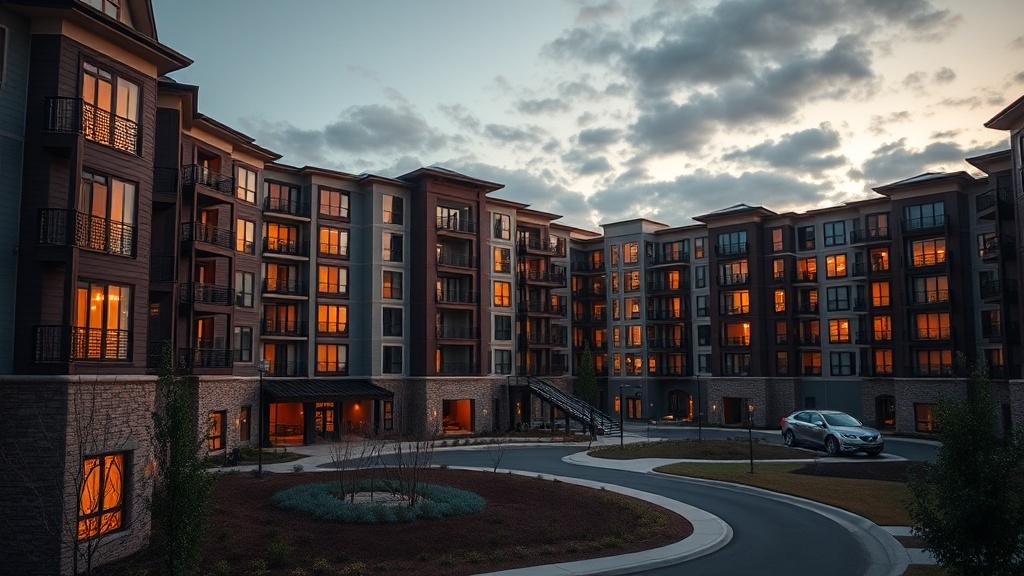


Did Providence Rental Vacancy Really Hit 6%?
How the 6% Providence rental vacancy claim was calculated remains unclear in currently available public data.
Verification Gap
Missing Providence Series
No source in the reviewed materials confirms Providence reaching 6%.
The U.S. Census Bureau’s annual Rhode Island rental vacancy rate series (RIRVAC) on FRED is not seasonally adjusted.
The absence of documented data methodology increases risk of reporting discrepancies between city-level claims and statewide measures.


State Data Signals Tightening
Rhode Island’s rental vacancy rate was 2.6% in 2024, down from 3.7% in 2023 and 4.6% in 2022.
That 2024 figure matches 2021 and returns to pandemic-era tightness.
Policy debate intensified as construction statewide left analysts dependent on incomplete local reporting.
Key limits in the record include:
- No Providence 2025-2026 vacancy release.
- RIHousing survey details not publicly provided.
National metro vacancy levels, 7.6% in 2025, are not a substitute for Providence-specific verification.
What Does a 6% Rental Vacancy Rate Mean?
Vacancy Measures Empty Units
A 6% rental vacancy rate measures the share of rental units sitting unoccupied during a given period. It reflects physical vacancy in available units and excludes seasonal units.
A 6% vacancy rate also implies about 94% occupancy. This level helps indicate how balanced the rental market is.
At 6%, the market is generally within the 5% to 10% “healthy” range. This tends to support housing resilience and stable pricing. Providence’s approved 2,300 residential units in the Port District could add supply that influences vacancy over time.
Below 5% can signal a shortage of available rentals. Above 10% can suggest oversupply or rents that are out of sync with demand.
Calculation
Vacancy can be calculated using units or time-based measures. Both methods are common depending on the data source.
| Method | Formula | Example |
|---|---|---|
| Units | vacant/total x100 | 50/500=10% |
| Days | vacant days/365 x100 | 30=8.2% |
Operational Signals
A 6% vacancy rate can imply steady demand, but leasing delays or repairs can push it higher. It may also reflect normal turnover between tenants.
Operationally, vacancy affects turnover costs, maintenance timing, and short-term revenue gaps for owners. These impacts are often manageable at this level, but they still influence cash flow planning.
How Providence Compares to Boston and U.S. Metros
While Providence’s rental vacancy climbed to 6%, the metro now sits in the 5% to 7% balanced range that signals closer supply-demand alignment.
Boston Comparison
Transit and Demographic Frictions
Boston stayed tighter at 3.2% vacancy in 2025, the lowest among the 50 largest metros.
It inched up from 3.0% in 2024.
Providence’s 6% level sits above Boston and above Rhode Island’s 2.6% statewide rate.
Transit connectivity links the metros, but demographic differences and job density shape housing churn.
With mortgage rates around 6.7%, the lock-in effect is keeping many homeowners from moving, which can sustain rental demand even as vacancies rise.
U.S. Metro Benchmark
Vacancy Gap Widens
Across the top 50 metros, average vacancy rose to 7.6% in 2025 from 7.2% in 2024.
That sits above the 6.9% pre-pandemic norm nationwide.
Providence remained below that average, nearer the 5% to 7% balanced band than many softer markets.
How a 6% Vacancy Rate Changes Providence Rents
At 6% vacancy, Providence shifts into a balanced market. Landlord pricing power typically weakens.
Price elasticity rises as tenants gain alternatives. More renters resist increases and shop around.
Rent Growth Disruption
Rents generally stabilize at this point. Annual gains are more likely in the 2–4% range instead of 5–10%.
Concessions also increase. That means more discounts, free months, or reduced fees.
Multi-unit buildings show the clearest pressure. Properties with 5+ units tend to sit near 6.4–8.6% vacancy and see more discounting.
Signals for rent forecasting
| Indicator | 2023-2024 tight | 6% balanced |
|---|---|---|
| Vacancy | 2.6-3.7% | 6% |
| Rent trend | faster growth | slower growth |
| Owner moves | fewer deals | more concessions |
Forecasting models typically lower near-term rent paths when inventory and active listings rise about 7.75%. This can happen even if statewide vacancy stays low and Providence apartments overall still look relatively tight.
What Renters and Landlords Should Do Next
Because Providence vacancy has moved into a more balanced range, negotiating leverage is shifting.
Lease decisions now carry higher short-term pricing risk.
Renters Face Volatility
Rents are diverging.
The city average is $2,574 (up 2.41%), while Zillow shows $2,110 (down $90 year-over-year).
With 882 listings, most value clusters between $2,001 and $2,500.
Neighborhoods like Wayland ($1,961) or Federal Hill ($2,196) can reset budgets.
Downtown pricing remains elevated today.
It’s about 7% above the citywide average and roughly 25% above Federal Hill levels.
Landlords Under Pressure
Landlords are emphasizing tenant screening and realistic pricing.
Rhode Island listings are up 15.35% year-over-year, increasing competition.
Preventive maintenance can limit downtime for studios near $1,988 and one-bedrooms near $2,403.
Landlords should also track the proposed Corporate Landlord Restriction Act, which would cap out-of-state owners at 75 units.
Assessment
Providence’s reported 6 percent rental vacancy citywide signals a sharp shift from recent ultra-tight conditions.
If confirmed across major submarkets, it suggests more units are sitting empty longer between leases.
Higher vacancy typically weakens landlord pricing power and expands concessions, especially in older inventory.
Comparisons with Boston and large U.S. metros indicate Providence remains tight but less insulated than before.
The next leasing cycles will reveal whether this is temporary noise or a sustained disruption.