

Boston Housing Market Snapshot for 2026
Two forces define Boston’s housing market in 2026: persistent competition and only modest relief on supply.
Boston remains intensely competitive, with homes averaging two offers and selling in about 23 days. Inventory is loosening, but only slightly. Redfin gives the city a Compete Score of 100, underscoring just how fierce buyer demand remains.
Zillow counted 2,407 homes for sale and 890 new listings in June, while citywide supply stood near 6.9 months. Even with some improvement, inventory growth has not been enough to shift leverage away from sellers.
Financing still constrains demand. A median-priced metro home required nearly $200,000 in annual income, and 30-year mortgage rates averaged 6.47 percent in June.
Even with easing rates, monthly payment pressure remains significant.
Long-run strain continues beneath the surface. Greater Boston still needs 28,000 homes to reach healthier vacancy levels and 121,000 additional homes over ten years.
Remote preferences and zoning reform remain central to how supply may gradually respond.
Boston Home Prices Show a Split Market
Boston’s price story is fracturing into separate market realities. Strong competition continues for lower- and mid-tier homes, while higher-end listings face slower demand.
Recent sales show a bifurcated market shaped by buyer preferences and neighborhood divergence. Citywide, homes averaged two offers, sold in 23 days, and reached a median price of $860,000, up 2.9 percent year over year.
Most homes sold near asking, with a 0.994 sale-to-list ratio. About 33.6 percent of sales closed above list price.
Similar prices can perform differently depending on property type and location.
Boston’s condo market is also being reshaped by a 29% inventory swell, giving buyers more negotiating power and pushing some sellers to adjust pricing.
The upper tier tells a different story. Homes above $2 million in places such as Lexington, Weston, Dover, and Newton often take 60 to 110 days to close.
They may also sell 3 percent to 8 percent below asking.


Boston Housing Market Inventory Is Rising
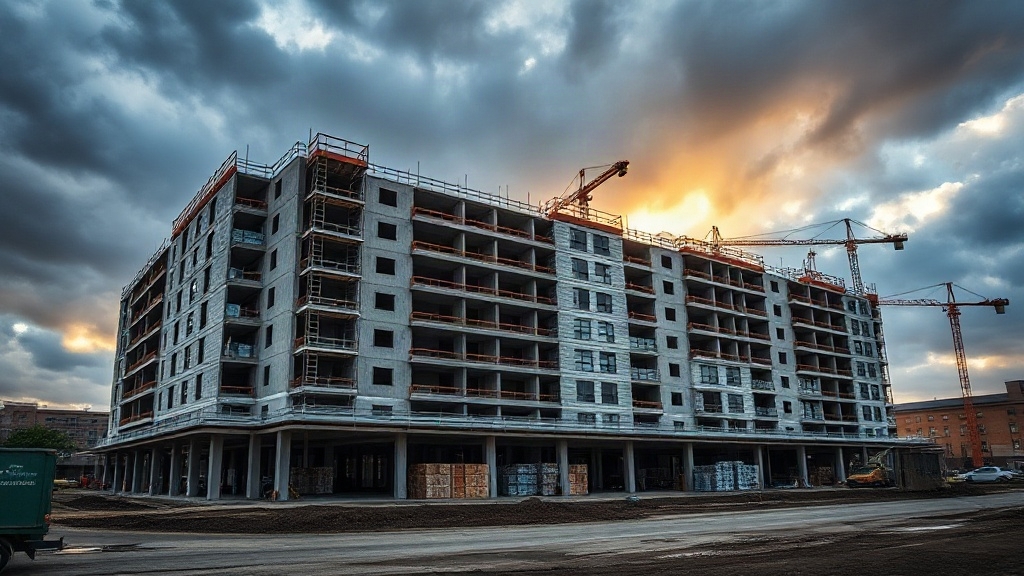
Supply is now rising across the Boston housing market, adding a new layer to the split conditions seen in pricing.
June 2026 listings climbed 11.6% from a year earlier to 13,520, the highest June level since 2020. That outpaced the 4.2% national increase, while new listings rose 15.5%, reflecting stronger seasonal listings.
Condos Lead the Shift
Condos remain a major source of added supply. Boston condo inventory jumped 37% year over year in May, with other updates showing smaller but still notable gains earlier in 2026.
That increase has fueled condo glut concerns in some pockets, even as it mainly signals a more balanced buyer environment.
Single-family supply also expanded. June inventory in that segment rose 7.6% to 7,543 listings, extending a three-year recovery from the 2023 low.
How Fast Are Boston Homes Selling?
Measured across major datasets, Boston homes are still selling faster than many U.S. markets. Even so, timelines vary by source and property type.
Redfin placed median days on market at 23 through June 2026. Realtor.com showed 37 in June, still below the national 53.
Boston.com reported 25 days in May.
Well-priced homes often go under agreement in 20 to 32 days. Hot listings can turn pending in under 15 days.
Overpriced homes may linger 40 to 60 days or more.
Property type also shapes timing. GBAR reported 37 days for single-family homes and 51 for condos in April.
This split market makes pricing strategy especially important, particularly when comparing neighborhoods. Competitive conditions are still clear, with two offers on average and 42.1 percent of May sales closing above original list price.
What Boston Buyers and Renters Should Watch in 2026
In 2026, buyers and renters in Boston are facing a market where small shifts in rates, supply, and neighborhood pricing can quickly change negotiating power.
Median sale prices reached $860K, while list prices neared $879K and values stayed elevated. Rates near the mid-6% range continue to pressure affordability and shape credit access.
Inventory loosened only slightly, and about two offers per home still signal competition.
| Signal | 2026 Reading | Market image |
|---|---|---|
| Sale price | $860K | Elevated floor |
| List price | $879K | Seller confidence |
| Mortgage rate | 6.47% | Tight payments |
| Supply | 6.9 months | Limited relief |
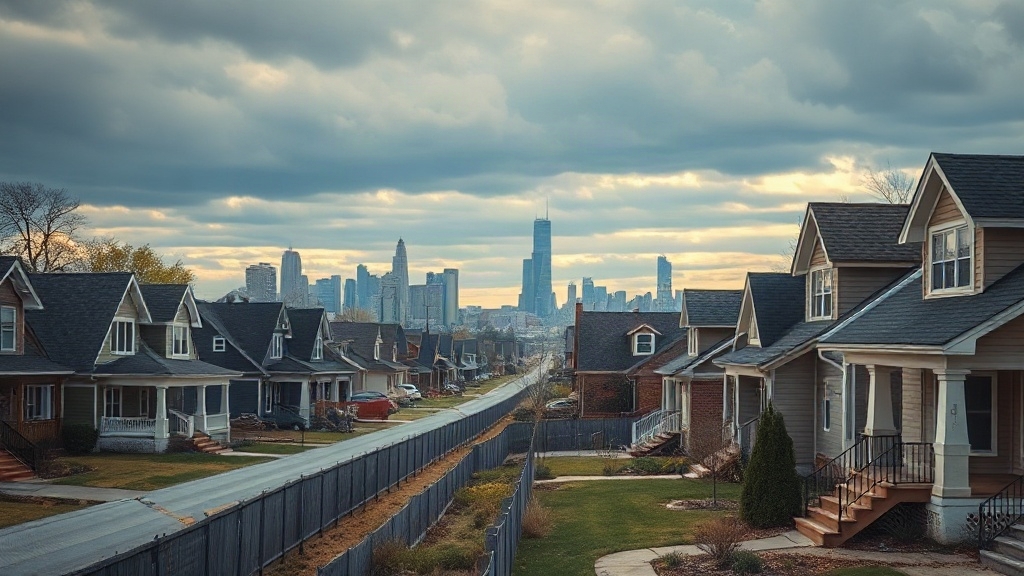
Neighborhood divergence matters. Inner-core prices cooled in some reports, while outer areas rose sharply.
Buyers and renters should track concessions, property-type differences, and commute preferences closely.
Assessment
Boston’s 2026 housing market stands apart for its unusual mix of resilience, constraint, and fragmentation.
Home prices remain firm in some segments even as inventory improves and conditions soften elsewhere.
Buyers face a market with more choice but little broad relief on affordability.
Renters continue to confront high costs despite shifting supply trends.
The result is a city market defined less by one direction than by sharp divides, with pressure persisting across nearly every housing decision.