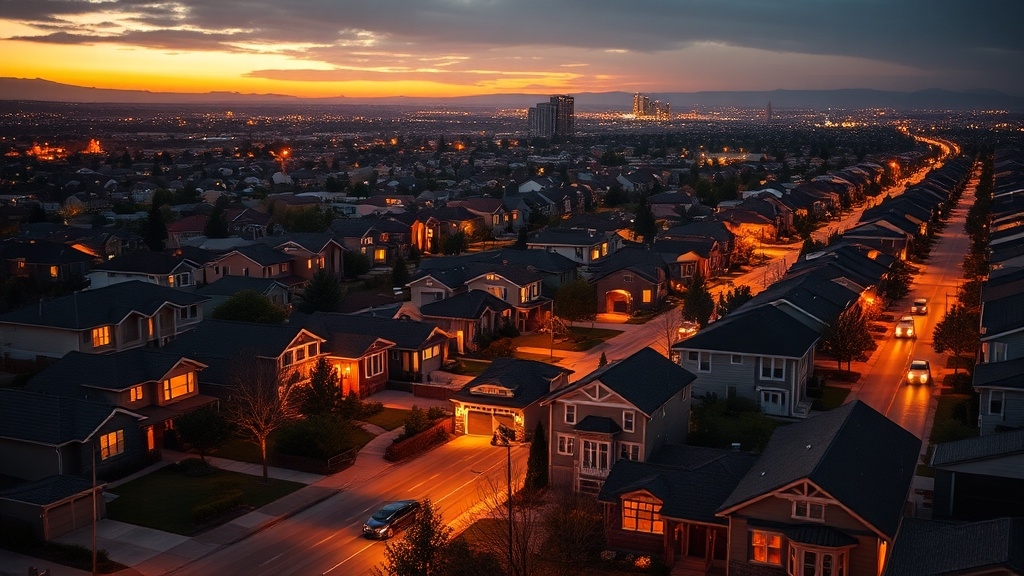


Why Hot Housing Markets Are Back
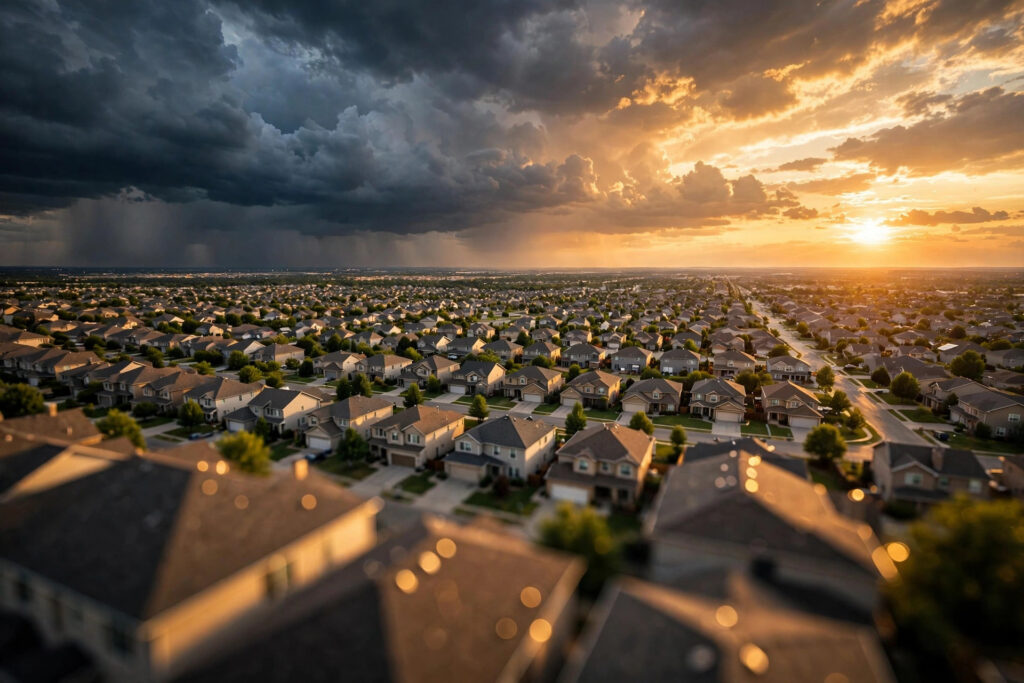
Amid a renewed spring selling season, hot housing markets are reappearing because supply remains unusually tight while buyer demand is returning in more selective ways.
Existing-home inventory has stayed constrained for years, and owners with sub-4% loans remain reluctant to sell. That mortgage psychology suppresses turnover, keeping available listings scarce and price pressure intact across many metros. A chronic supply shortage after years of underbuilding is a major reason listings remain scarce. Even with inventory rising nationally, it remains below pre-pandemic norms, reinforcing a broader supply gap in many markets.
Tight Supply Meets Selective Demand
Buyer activity is improving as households adjust to higher borrowing costs rather than abandon plans entirely. Spring seasonality strengthens that shift because school calendars, weather, and showing traffic traditionally lift movement.
Demand is concentrating in places where pricing feels realistic and affordability better matches local incomes. In this environment, policy incentives matter less than local value, job access, and persistent supply-demand imbalance.
Signs of a U.S. Housing Rebound
Across the U.S. housing market, early rebound signals are becoming harder to ignore. Supply conditions are improving, affordability is easing from extreme levels, and sales activity is beginning to recover.
Inventory is moving toward better balance. The housing shortfall is expected to shrink as new supply outpaces slower household formation.
Rising vacancy rates also point to rental normalization. The market appears to be drifting closer to historical norms.
The latest data also showed existing home sales rose 1.5%, adding to signs that national housing momentum is rebuilding.
Affordability and Demand Shift
Price pressure relative to household income has begun to ease from peak strain. The affordability index moved back above 100, suggesting median-income households are again more likely to qualify under standard assumptions.
Steadier mortgage rates and improved credit access are helping support that shift. Existing-home sales have also posted stronger readings, reinforcing the view that buyer participation is returning.
Builder sentiment remains below full confidence. Still, improving expectations add to the evidence that housing conditions are stabilizing nationally.


Contract Signings Hit a Four-Year High
April 2026 contract signings rose 4.5% from a year earlier. That was their strongest annual gain in roughly three years and the highest level since 2022.
The increase suggested delayed demand was returning as buyers re-entered a market showing clearer signs of stabilization.
Competitive seller pricing and a firmer flow of listings appeared to help turn renewed interest into signed deals.
Spring Signing Surge
Two spring indicators finally turned upward together, pushing contract signings to their strongest level in four years.
Realtor.com reported April 2026 signings rose 4.5% from a year earlier, after a 2.9% gain in March.
New listings also increased 1.4% through April, reinforcing seasonal momentum and shifting buyer psychology toward action.
For the first time in three years, listings and signings advanced together during spring.
That alignment mattered because signings had remained roughly 20% to 25% below 2022 levels from 2023 through 2025.
Year-to-date, signings were up 2.9% versus 2025 and 4.1% above the 2023 low.
Among the 50 largest metros, 34 posted higher signings and 21 showed gains in both listings and contracts.
Midwest markets, including Kansas City and Louisville, led the rebound.
Delayed Demand Returns
Delayed Demand Returns
Pent-up demand pushed back into the market as contract signings rose 4.5% year over year in April 2026, according to Realtor.com. It marked the strongest annual gain in three years.
The increase lifted signings to their highest level since 2022. It also suggested that pent-up buyers were no longer waiting on the sidelines.
Year-to-date activity ran 2.9% above 2025 and 4.1% above the 2023 low.
- Pending sales also strengthened, with NAR reporting a 1.5% monthly rise in March.
- Redfin showed pending home sales up 7.7% year over year through early May.
- More inventory and lower mortgage rates helped convert interest into contracts.
The rebound pointed to delayed closings ahead. Signed deals typically lead completed sales by several weeks across many U.S. hot markets.
Pricing Drives Deals
Contract signings climbed to a four-year high as more sellers met the market with disciplined pricing.
That sharpened buyer response across major metros.
Realtor.com said April 2026 signings rose 4.5% from a year earlier. It was the strongest annual gain in roughly three years.
Year to date, signings increased 2.9%, while new listings rose 1.4%.
That shows demand responded faster than supply.
Price Psychology Reshapes Buyer Action
Competitive pricing from the start improved buyer action. It also reflected price psychology and tighter alignment with expectations.
The median list price per square foot fell 2.4% year over year. Meanwhile, the share of listings with price cuts dropped 1.25 points.
Listing Timing and Market Function
New listings reached their highest level since 2022. They were up 22% from the 2023 trough.
Better listing timing and pricing discipline helped convert supply into signed contracts. That played out across 34 of 50 major metros.
Pricing Resets Are Bringing Buyers Back
More realistic home prices are beginning to pull buyers back into the market, as affordability shows early signs of improvement.
With price growth slowing and discounts widening, delayed demand is starting to reappear.
Mortgage rates settling in the low-to-mid-6% range are also helping support this shift.
The market is moving toward a more balanced environment, giving buyers less pressure and more room to negotiate.
Realistic Prices Reengage Buyers
A growing share of buyers is returning when sellers reset expectations to match current market conditions.
Realistic pricing reduces the sticker effect and makes psychological pricing more effective in a market shaped by higher mortgage rates.
With 56% of May sales closing below asking and price-to-list ratios near 98%, buyers are responding to homes that reflect present value.
- Homes priced near true market value appear in more search brackets and buyer alerts, improving early visibility.
- A decisive reset often works better than repeated cuts, which can weaken urgency and perceived value.
- Well-priced listings can still move fast, with homes going pending in about 21 days nationally.
Accurate pricing also supports stronger offers by aligning expectations with comparable sales and current affordability.
This limits wasted time with hesitant buyers.
Delayed Demand Reappears
Across several U.S. markets, buyer demand is beginning to thaw as pricing resets reduce the affordability shock that froze activity for months.
Harvard’s Joint Center for Housing Studies has described sales conditions as the weakest in 30 years, yet the pause has reflected financing pressure more than panic.
Affordability Threshold Nears
With home values up nearly 33% in five years, many households delayed purchases while waiting for better payment terms, slower appreciation, or seller concessions.
That restraint created latent demand now stirring where rising inventory and flatter pricing are moving markets toward an affordability tipping point.
Price Resets Liberate Activity
In select metros, modest listing cuts and stabilizing values are narrowing the gap between buyer and seller expectations.
As national price growth trends toward zero in 2026, buyers face less pressure to chase homes immediately.
Where Hot Housing Markets Are Clustering
In 2026, the hottest housing markets are clustering most clearly in the Northeast and California’s Bay Area. Buyer competition remains intense because listings are scarce.
This coastal clustering reflects deep inventory shortages rather than a broad national surge. Zillow and Realtor.com both show demand concentrating where supply remains most constrained.
Key Pressure Points
Connecticut, New Jersey, Rhode Island, and New York lead state-level heat. Connecticut posted a 93.9 composite score.
Hartford rose to Zillow’s top metro spot. New York City climbed sharply, and Philadelphia still ranked despite the lowest listed heat index.
San Francisco, San Jose, and Oakland remain prominent. Construction limits continue to keep Bay Area supply tight.
Midwest and Northeast markets also appear frequently in monthly rankings. Still, the defining 2026 pattern is localized scarcity, not uniform national acceleration.
The 21 Housing Markets Gaining Speed
A rebound is taking shape in 21 major metro areas where active listings have climbed back to or above 2019 levels. That shift is giving buyers more leverage and easing price pressure.
Regional hotspots include Memphis, Austin, San Antonio, Tampa, and Oklahoma City. Added momentum is also showing up in Charlotte, Seattle, Houston, Las Vegas, and Raleigh.
The pattern suggests renewed buyer heat is being driven less by scarcity. Instead, it reflects a closer alignment between supply, pricing, and demand.
Rebound Drivers
Inventory normalization is emerging as the central force behind the 21 housing markets gaining speed.
Among the 50 largest metros, 21 now have more homes for sale than in the same period of 2019, up from 13 a year earlier. These inventory dynamics are expanding buyer choice and shifting leverage away from sellers.
- Sellers are adjusting prices to a softer demand backdrop, improving alignment with local budgets and affordability thresholds.
- New listings and contract signings have reached their strongest level in four years, signaling renewed transaction flow.
- Lower or stabilizing prices are narrowing the gap between buying and renting, drawing delayed buyers back.
Markets with restored supply have generally seen weaker recent price growth, while tighter markets posted stronger gains. That contrast helps explain why revived supply and better pricing are now driving momentum.
Regional Hotspots
Regional Hotspots
Across the latest Realtor.com ranking, 21 major metros emerged as the clearest housing markets gaining speed for buyers. Spring 2026 inventory in these areas moved above the same period in 2019.
This supply recovery expanded the buyer-friendly group from 13 markets a year earlier. It also marked the strongest shift in negotiating conditions among the 50 largest metros.
Cooling Centers
Memphis, Austin, Denver, San Antonio, Tampa, Oklahoma City, Charlotte, Seattle, Houston, Las Vegas, Raleigh, Birmingham, San Francisco, and Portland stood out within the list.
Texas and Florida appeared repeatedly. That reflected elevated supply, slower absorption, and more frequent price cuts.
Repricing Signal
Western metros also showed improving buyer leverage. Inventory normalized while rapid pandemic-era appreciation cooled.
Together, these 21 markets signaled a regional divide. Supply-rich metros softened faster, while constrained markets remained tighter overall.
Northeast Markets Still Favor Sellers
Despite broader signs of cooling in the national housing market, the Northeast remains one of the clearest seller-favored regions in the country.
Sales from Richmond to Portland continue at a pace resembling the 3% mortgage-rate era. Regional prices rose 4.2% year over year in June, compared with a 2% national gain.
Contract activity also increased 2.1%, underscoring resilient demand.
Pressure Points
Inventory dynamics remain restrictive because supply, while improving, stays below pre-pandemic norms in many metros.
Buyer demographics skew relatively strong, with affluent households and value-seeking movers supporting demand despite mid-6% mortgage rates.
Limited new construction and scarce replacement housing keep multiple-offer competition active and price growth elevated.
Even as some pressure has eased since 2024, many Northeast markets still move quickly and continue to favor sellers overall.
Rochester Leads the Hottest Seller Markets
Rochester stands out even within the Northeast’s seller-leaning environment. It is posting some of the strongest pressure metrics in the country as buyer competition stays intense and supply remains severely constrained.
Realtor.com ranked Rochester No. 2 nationally for 2026. The market’s combined forecast growth reached 15.5%, including a 5.3% rise in existing-home sales and a 10.3% gain in median sale price.
Buyer Heat Intensifies
Homes sold at 106.11% of asking price. Meanwhile, 65.22% closed above asking, highlighting strong multiple-offer pressure.
Inventory measured just 0.3 months. Price cuts also declined to 22.83%.
Affordability and Seller Leverage
The median sale price was $155,000. February sales also jumped 37.13% year over year.
Affordability in Rochester remains strained, yet demand continues to persist. Seller strategies are still benefiting from tight supply, strong equity, and steadier lending conditions.
Buffalo, Hartford, and Boston Stay Competitive
Buffalo keeps buyer pressure elevated, while Hartford and Boston reinforce how deeply competition remains embedded in Northeast housing.
Buffalo remains intensely competitive, with Zillow ranking it among the hottest large markets and reporting back-to-back leadership in 2025. Prices rose across major trackers, homes often draw four offers, and inventory dynamics still favor sellers despite more active listings.
Hartford’s ascent to Zillow’s top spot for 2026 shows how quickly heat can consolidate in supply-constrained metros. Strong competition and price pressure continue to define conditions there.
Boston shows that high costs do not erase demand. Constrained supply, stable employment, and relocating households keep competition firm, while buyers increasingly rely on disciplined offer strategies in fast-moving transactions.
These markets reflect durable Northeast buyer intensity overall.
New York City and Bridgeport Keep Heat
New York City and Bridgeport extend that Northeast pattern, showing that buyer heat remains concentrated in supply-constrained markets even as conditions cool in parts of the country.
Seller Pressure Persists
In New York City, the median sale price reached $865,000 in March 2026, up 4.8 percent from a year earlier.
The city also remained a hotter metro, while sellers kept modest leverage. Land scarcity, high costs, and global demand continued to limit listings.
Rent and Corridor Demand Intensify
Citywide asking rent held near $3,500, keeping household pressure elevated. That also reinforced purchase demand where possible.
Bridgeport tied for 13th in Zillow’s hot-market ranking with a score of 74. That signaled a sellers market near a stronger threshold.
Inventory tightness, resilient corridor demand, and commuter incentives continued to support competition across both markets.
Large-City Housing Markets Making a Comeback
Rebounding demand is beginning to reshape many large-city housing markets as the pandemic-era urban flight narrative continues to fade.
Renewed interest reflects reopening activity, vaccine-era confidence, and pent-up demand for urban amenities.
Migration away from major metros has slowed, occupancy is improving, and some rents have started rising again.
- New listings are increasing in several big metros, giving buyers more choices and improving leverage.
- Price trends are mixed, with roughly one-third of major cities posting early-2026 median sale price declines as markets normalize.
- Shifting commute patterns and easing financing costs are helping restore city appeal while softening the extreme competition seen in 2021 and 2022.
The result is a more balanced environment.
Large-city housing is not universally hot, but many markets are moving toward steadier, buyer-friendlier conditions.
San Francisco Leads Large-City Hot Markets
San Francisco leads Construction Coverage’s large-city hot-market rankings, posting an 83.0 score and signaling intense buyer demand relative to available supply.
A broader regional pattern is also evident, with San Jose at No. 2 and Oakland at No. 6.
Several Northeast and California markets continue clustering near the top.
The early picture points to a market defined by scarcity, fast-moving listings, and sustained competitive pressure in major urban centers.
San Francisco Tops Rankings
Among large U.S. cities, San Francisco emerged as a standout in recent hot-market data. It posted the biggest year-over-year climb in Realtor.com’s November 2025 rankings, rising 36 spots to No. 109 from No. 145 a year earlier.
The move reflected stronger buyer demand, fast sales, supply constraints, and a tech rebound. That came in a market still defined by high costs.
Buyer Heat Signals Intensify
Realtor.com’s ranking tracks listing views and sales pace. Both pointed to elevated buyer interest.
Construction Coverage’s 2026 analysis ranked San Francisco first among large cities. It gave the city a score of 83.0.
Competitive signs included quicker market times, more above-asking sales activity, and fewer price reductions.
Together, those measures showed San Francisco outperforming many large metros. It did so despite elevated borrowing costs and broad national housing softness.
Northeast And California Cluster
Across Northeast and California coastal markets, buyer heat is returning as supply stays tight and affluent demand concentrates competition in premium neighborhoods.
This coastal clustering is especially visible in San Francisco, where inventory remains severely constrained and pricing power has strengthened.
Typical home values reached $1,369,171 in late April 2026, up 6.0% from a year earlier, while homes moved to pending in about 13 days.
San Francisco Pressure Point
January active listings fell 36.2% year over year to 402, and new listings dropped 20.9% to 326.
That shortage helped lift the share of homes selling above list to 73.3%, with single-family sale prices averaging 15.8% over asking.
At the upper end, tech wealth and AI-driven liquidity accelerated luxury demand, with sales above $5 million jumping more than 200%.
San Jose and Oakland Rejoin the Hot List
Buyer competition is pushing San Jose and Oakland back into the national hot-market discussion. Demand is firming in supply-constrained Bay Area metros.
San Jose re-enters the conversation with Zillow naming it a top 2026 market. Typical home value stands at $1,452,609, while homes move to pending in about 12 days.
Among tech hubs with strong transit access, Construction Coverage ranks San Jose second among large cities. It earned a 77.3 score.
Oakland is also gaining strength. Construction Coverage places it sixth with a 69.6 score.
Yahoo Finance calls Oakland California’s most desirable city for homebuyers. Its median price is $868,000, up 2.1% year over year.
Both cities reflect concentrated Bay Area heat. Limited inventory, job growth, and persistent in-migration continue to keep buyer activity elevated despite affordability pressure and high mortgage rates.
Minneapolis, Chicago, and Milwaukee Gain Speed
Minneapolis, Chicago, and Milwaukee are gaining speed as buyer heat intensifies across key Midwest housing markets.
Minneapolis is holding firm among hotter metros, while Chicago is showing faster sales and sustained demand.
Milwaukee is posting the strongest acceleration of the three.
Together, the trio reflects how relative affordability, tight supply, and steady competition are reshaping the map of U.S. market resilience.
Minneapolis Momentum Builds
Fresh supply and steady price gains are sharpening market momentum in Minneapolis, where buyer competition remains active even as conditions grow less frenzied.
Median sale price reached $355,000 in March 2026, up 6.0% from a year earlier, while broader value measures showed slower appreciation. That pattern points to sustainable growth rather than another rapid surge.
Active listings rebuilt to roughly 2.5 to 3.1 months of supply, giving buyers more choice. Homes still moved quickly, averaging about 30 days on market, with hotter listings drawing multiple offers.
Affordability remained central as rates stayed in the 6% range and sellers used concessions.
Demand also reflects neighborhood revitalization and transit access, especially in areas where manageable pricing supports continued interest. Seller leverage persists, but it is easing as inventory improves.
Chicago Buyer Heat
Tightening supply is intensifying competition in Chicago, where demand is proving resilient even as closed sales soften.
March 2026 home sales totaled 1,766, down 4.3% from a year earlier, while inventory dropped 28.8% to 2,981 homes.
That imbalance pushed the median price to $409,200, up 7.7%, reinforcing how limited listings and steady demand are sustaining upward pressure.
Demand Re-enters
Across the metro, pending sales rose 19.2% year over year through May 3, signaling renewed buyer engagement despite higher rates.
Forecasts call for modest sales growth in 2026, with activity improving faster than supply conditions.
Uneven Pressure Points
Chicago remains a tale of two markets shaped by neighborhood dynamics and price tiers.
Downtown and some luxury segments appear balanced, while tighter areas require sharper inventory strategies, selective buyers, and careful seller pricing.
Milwaukee Market Acceleration
Accelerating buyer demand and chronic supply pressure are pushing Milwaukee into a faster, more competitive phase. Redfin identified it as the most resilient major U.S. housing market.
Home sales rose 12% year over year, while prices increased 8.2%. That confirms persistent competition in a market still considered comparatively affordable.
Signals of Intensifying Heat
Sellers are regularly securing above-list offers. A near-100% list-to-sale ratio reinforces pricing strength.
Limited inventory continues to tighten conditions. With roughly 1,500 listings and one of the nation’s lowest supply levels, the market remains highly constrained.
Broader Upper Midwest momentum is also strengthening demand. Milwaukee’s manufacturing revival and waterfront development are adding to that pull.
Homes moved in a median 37 days. That pace reflects brisk absorption.
Even with mortgage rates near 6%, Milwaukee remains attractive relative to coastal markets. Zillow also placed metro Milwaukee among 2026’s hottest housing markets.
Seattle, Omaha, and Baltimore Attract Buyers
Across widely different price tiers, Seattle, Omaha, and Baltimore are drawing notable buyer attention as 2026 market-heat rankings spotlight demand that has not faded under elevated borrowing costs.
Demand Stays Concentrated
Seattle ranked 10th among large cities with a 65.3 score, while Omaha ranked 8th at 68.4 and Baltimore 9th at 65.8.
Seattle’s market heat reflects selective demand shaped by neighborhood dynamics and commuter patterns.
Zillow put Seattle’s typical home value at $871,599, down 2.5 percent year over year, yet desirable listings moved to pending in about eight days.
Inventory reached 2.9 months in late 2025, still below balanced conditions.
Omaha’s top placement in U.S. News reinforced broad affordability-driven demand.
Baltimore showed Mid-Atlantic strength, with buyers favoring livability and relative value over higher-priced coastal alternatives.
Virginia Beach Breaks Into the Hot List
Virginia Beach has now joined Seattle, Omaha, and Baltimore on the 2026 hot-market radar, with buyer demand holding firm even as borrowing costs keep affordability under pressure.
The city’s market shows steady, moderate growth. Zillow places average home value at $414,961, up 2.3% year over year, while local reporting describes a healthy, balanced environment.
Homes typically go pending in about 30 days, signaling persistent competition amid low inventory. Demand stays supported by military relocations, retiree influx, and limited new construction across Hampton Roads.
Forecasts generally call for 2.1% to 3% appreciation through late 2026, with mortgage rates near the low-6% range.
Spring and early summer remain the strongest periods, reinforced by school calendars and weather. Price gains have cooled, but expectations still point to modest, positive growth.
Buyer-Friendly Housing Markets in 2026
Shifting conditions are widening the map of buyer-friendly housing markets in 2026, even as affordability remains strained in many metros.
Zillow’s framework across the 50 largest metros weighs affordability, upside potential, and competition. It points to strong opportunities in the Midwest and Sun Belt.
Buyer-friendly conditions reflect healthier inventory dynamics, easing competition, and better income alignment than in many pandemic-scarred markets.
Notable Markets Beyond the Leaders
Atlanta ranks second with substantial listings. Charlotte places third with comparatively balanced conditions.
Jacksonville, Oklahoma City, and Memphis round out the next tier. Each shows lower pressure and signs of market resilience.
Florida stands out with Jacksonville, Miami, and Tampa in the top 10.
Yet buyer-friendly does not always mean cheap. Miami’s mortgage burden reaches 46.7 percent of median income, versus 35.2 percent in Tampa and 22.2 percent in Pittsburgh.
Indianapolis Leads the Best Buyer Markets
Zillow places Indianapolis at the top of its 2026 buyer-friendly housing market ranking, identifying the metro as the strongest opening for purchasers among the 50 largest U.S. markets. The designation reflects a softer environment shaped by manageable competition, cooling prices, and a favorable affordability outlook.
Median sale prices near $245,000 to $249,900 keep Indianapolis comparatively accessible. Homes typically draw about two offers and sit 51 to 55 days, giving buyers more time.
Nearly half of active listings have seen price cuts, strengthening negotiation leverage. Zillow’s framework weighs affordability, competition, and expected price trajectory.
Indianapolis performs well across all three signals. Recent data also shows sale-to-list ratios near 97.8% to 97.9%, confirming reduced seller control.
Together, these conditions make Indianapolis the clearest buyer entry point in Zillow’s top 10 group.
Atlanta, Charlotte, and Jacksonville Favor Buyers
Buyer leverage extends beyond Indianapolis into Atlanta, Charlotte, and Jacksonville, where 2026 housing conditions also tilt toward purchasers.
Zillow ranks Atlanta second, Charlotte third, and Jacksonville fourth among the 50 largest metros for buyer-friendly conditions. All three appear in Zillow’s top five, reflecting softer competition and stronger negotiating positions.
Inventory Dynamics Deepen the Advantage
Redfin-based reporting shows sellers outnumbering buyers by 52.9% in Atlanta and 75.6% in Charlotte. In Jacksonville, sellers outnumber buyers by 96.3%.
Those gaps indicate clear buyer leverage on price, repairs, and closing costs.
Atlanta and Charlotte present relatively balanced opportunities, pairing affordability and potential appreciation with calmer bidding conditions.
Jacksonville stands out for inventory dynamics that reduce bidding-war pressure and improve value-seeking options.
Together, these metros reflect a broader 2026 Sun Belt shift toward negotiation-friendly housing markets.
Austin, Dallas, and Houston Give Buyers Leverage
Austin, Dallas, and Houston are deepening Texas’s 2026 shift toward buyer leverage. Redfin-based reporting shows sellers outnumbering buyers by roughly 112% to 130% in Austin, about 87% to 100.4% in Dallas, and around 83.8% to 97% in Houston.
Austin shows the strongest inventory impact. Supply ranges from balanced to 6.5 months, while longer marketing times and post-pandemic price normalization support broader negotiation tactics.
Dallas remains comparatively active, but pricing is softer. With roughly 65 days on market and a median sale price near $429,950, buyers have more room to request repairs, rate buydowns, and closing-cost concessions.
Houston combines affordability with buyer leverage. Prices near $335,000, about 70 days on market, and high supply relative to demand strongly favor first-time and move-up purchasers.
What These Housing Markets Mean for 2026
While the national housing market is expected to stay mostly flat in 2026, local conditions may still vary sharply by metro. Redfin projects about 1% median home-sale price growth, while J.P. Morgan expects little to no overall appreciation.
Buyer Pressure Builds
In hotter markets, tight supply is still outpacing demand. That limits negotiation and keeps sale-to-list ratios elevated.
This is especially important in the Northeast. Hartford, Providence, and several New York City suburbs remain competitive because listings are scarce and homes are moving quickly.
Affordability Shifts Demand
Midwest and smaller metros may also gain strength as buyers respond to affordability, mortgage access, and migration trends. Even in a subdued national market, local conditions can still create strong competition.
Places like Cleveland, Columbus, and Kansas City could continue to see buyer heat. Lower prices and limited supply are helping keep those markets competitive.
Assessment
The return of 21 hot U.S. housing markets signals a sharp shift after a prolonged slowdown. Rising contract activity and price adjustments suggest buyers are stepping back in where affordability and leverage have improved.
Cities such as Indianapolis, Atlanta, Austin, and Houston are emerging as key pressure points in this rebound.
If these trends hold, 2026 could bring a more competitive housing environment. Regional buyer advantages may begin to narrow as demand continues to recover.